Analytics FAQ
Understanding different metrics and analytics shown on Subbly dashboard
Knowing your metrics is very important. With our Analytics you are able to gain insight on some important stats that will help you forecast your sales or give you ideas on the improvement areas that you'll need to work on. Please review this article for a more detailed information on how we're calculating each one of these stats.
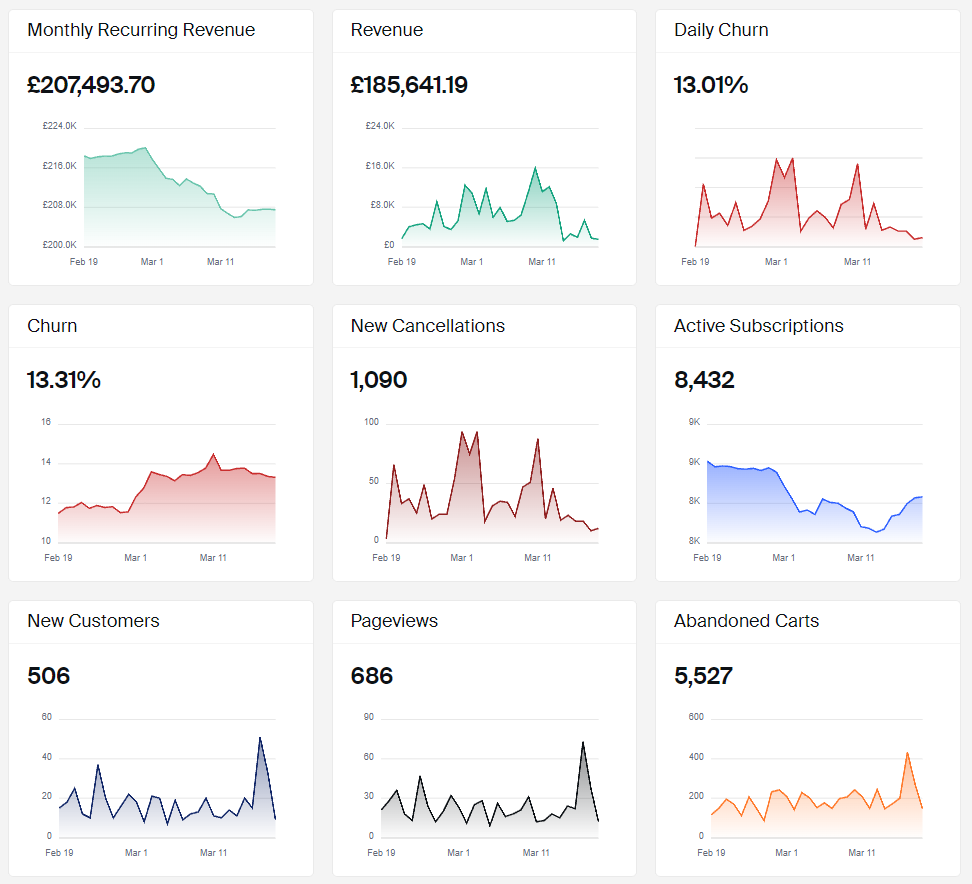
Monthly Recurring Revenue (MRR)
Best possible way of understanding this one is by showing a simple example. Let's say that you have 10 customers each paying $10/mo on a recurring basis. MRR will than be:
10 x $10 = $100
Revenue
Revenue metric is calculated as:
Sum of orders total for the date/date range - sum of refunded amount for the selected date/date range
Churn
Churn Analytics include by default the early churn that, like shown below, will help you get more accurate calculations to have a clear reading on what to improve.
Formula used:
SUM((Number of active subscribers at the start of the day) - (Number of active subscribers at the end of the day) / (Number of active customers at the start of the day))
Note that new customer gained that day are excluded from the calculation, as well as customers who churn and then reactivate on the same day.
If we wanted to see the churn rate for the period of Monday - Tuesday, we would do this calculation:
Monday: (100 - 95) / 100 x 100 = 5%
Tuesday: (95-90) / 95 x 100 = 5.26%
SUM(Monday churn rate + Tuesday churn rate) = 10.26% customer churn rate
Accumulative Churn
This one can be enabled by turning on the toggle on top of the churn graphic and doesn't take into account the early churn:
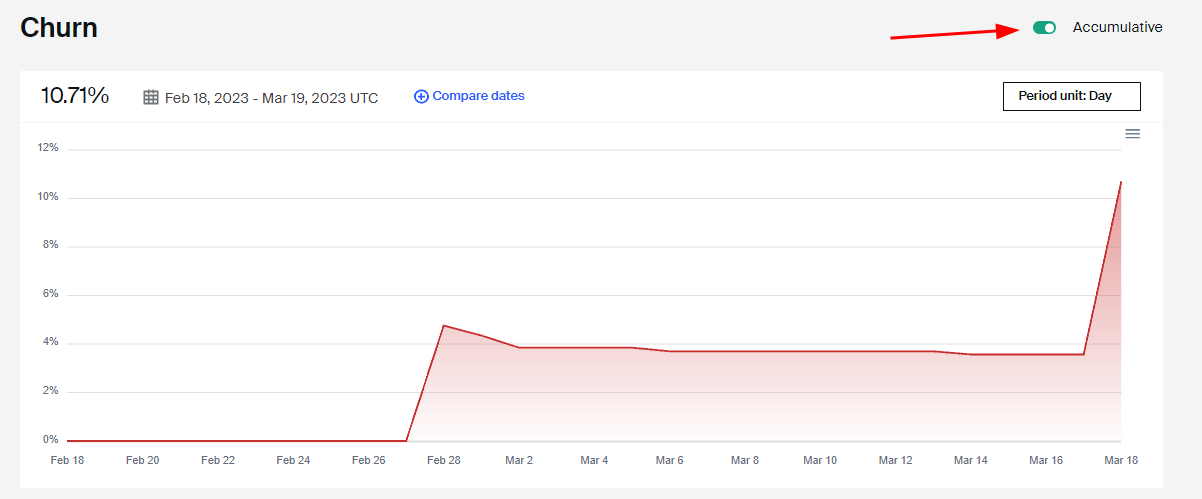
It is calculated as follows:
(Sum of cancelled subscriptions in the last 30 days / How much active subscriptions were active on the store 30 days ago) x 100
New Cancellations
Simple sum of all cancelled subscriptions on the selected date/date range.
Active Subscriptions
Sum of all active subscriptions on the selected date/date range.
New Customers
Count of all new customers (both subscription and one times taken into account here!) within the selected time period (number of customers at the end of the time frame - number of customers at the beginning of the selected time frame).
Pageviews
Number of pageviews within the selected time period.
Abandoned Carts
Count of all carts that were abandoned and were not revisited within the certain date range.
New Subscriptions
Count of all new subscriptions within the selected time period (number of active subscriptions at the end of the time frame - number of active subscriptions at the beginning of the selected time frame).
Lifetime Value of Customer (LTV)
LTV is a very important metric that is used for projecting the growth of the business based on average MRR and average churn. Put in simple words, LTV actually shows how much money a customer is going to give to your business before he/she ultimately unsubscribes and churn.
As the LTV is affected by churn metrics, you'll also see the changes explained in the churn section above.
Formula would be:
Average MRR per customer / Average Churn
Formula with the early churn analytics (not accumulative):
Average MRR per customer / Average Churn (using the updated formula explained above)
Both average MRR and churn are calculated in regards to the selected time period and based on the calculations presented above in the article
Based on this, LTV can be boosted by either increasing the MRR per customer/user or by reducing churn of your business.
FAQ
How do you calculate churn on the customers who are skipping the payment?
These are not taken into consideration when calculating churn .
How did we do?
Adding conversion tracking to the checkouts
Setting up Addons Upsell